What is the windSensor PRO used for?
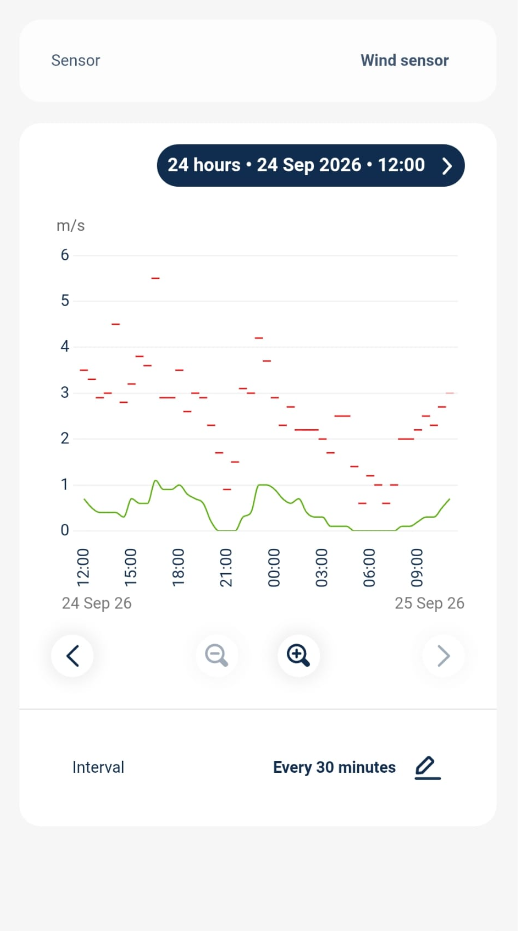
The windSensor PRO allows you to monitor wind speed, and thanks to its built-in Wi-Fi, you can record and view the readings from anywhere in the world. The device displays three parameters: the instantaneous (current) wind speed, the gust speed (maximum) and the average speed over the last 10 minutes.
How can the windSensor PRO be powered? Does the windSensor PRO have a battery?
A voltage of 12–24 V DC is required to power the device. You can use a mains power supply or a gel battery, for example a 12V 7Ah battery, which will provide power for around 8–9 days.
How long is the cable between the controller and the anemometer? Can it be extended?
The cable supplied with the kit is 2 metres long; it can be extended by a reasonable amount (a few to a dozen or so metres). Recommended cable: LiYY 3×0.25.
What can the windSensor PRO control, and how? Examples of applications.
The windSensor PRO can wirelessly control up to 30 other BleBox devices, automatically opening or closing awnings, shutters, roller blinds or windows in strong winds. When connected to the shutterBox controller, it enables full automation of protection against wind damage.
Specialist applications:
A preliminary measuring station prior to the construction of a wind farm, to initially check the frequency of winds exceeding 5 m/s. Export of measurement data to files for further analysis.
Is it possible to view historical data and create a graph using windSensor PRO?
You can view historical data and create a graph using our sensors. The controller allows you to view measurement history ranging from two hours to one year. To use this feature, the controller must be connected to a Wi-Fi network. Measurement data is stored on the servers for one year, and for archiving purposes, it can be exported to .csv and .xlsx formats.
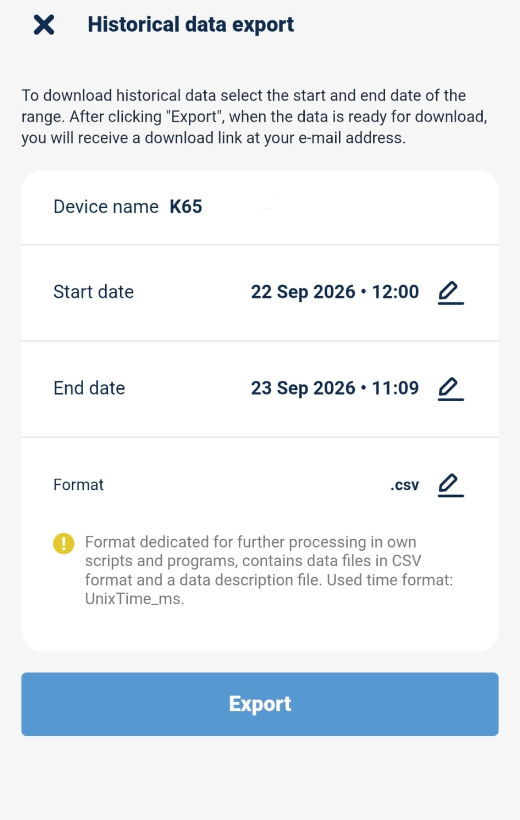
The data recording interval varies depending on the time period: for data from the last week, the interval is 5 minutes; for data from the last month, it is one hour; and after one month, data is recorded at one-day intervals.
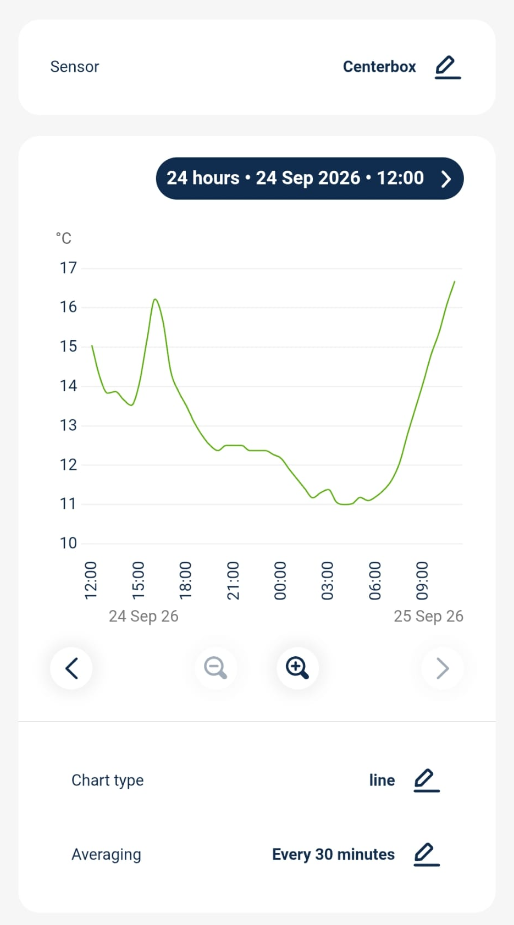
For controllers with multiple sensors or data types, the user can choose which sensor and what data to display on the graph. You can also change the graph type to customise the data presentation to suit your preferences.